时间序列数据服务常见问题
在这里您可以找到有关时间序列数据服务的常见问题。 您还可以找到关于如何按照需求定制时间序列数据服务的有用说明。
Time Series Data Service – Basics
创建定制仪表板
Select data
Select visualization
General options
开始创建您的仪表板,请单击左下角的小用户图标,点击“切换”按钮,然后点击邮箱地址后面的“切换到”按钮。
从那时起,您已切换到您的个人组织,在此您可以创建您的私人仪表板,只有您个人可以访问。
切换到您的个人组织后,您就可以通过选择左侧边栏的[+]按钮来创建新的仪表板。 这将创建一个空仪表板。
仪表板由面板组成,面板可以按照各种方式排列。 点击屏幕上方的“添加面板”,可以向仪表板中添加新面板。
选择数据
如要在设备中检索数据,您必须创建查询。 查询发送至我们的云数据库后,会为您提供结果数据。
您可以点击“图形助手”构建查询。
- 点击屏幕左侧的[+]号,然后点击“仪表板”
- 点击“添加查询”,开始创建您的新仪表板
- 从“查询”旁边的下拉菜单中选择数据源
- 用图形编辑器构建查询
- 首先在“FROM”行中选择UUID,点击“Where”旁边的 [+]
- 现在,点击“选择标签值”来选择UUID
- 在“FROM”行中,点击“选择测量”,然后选择要在您的仪表板中显示的数据
- 在“SELECT”行中,您现在可以通过点击“平均值”旁边的 [+] 来更改图表内的数据字段
- 在“GROUP BY”行中,您可以设置图表内的数据间隔
- 通过在“ALIAS BY”行中输入名称,可以为数据提供一个新的别名
- 如果您的数据写入频率小于“GROUP BY”行中的写入频率,则可以在此处进行设置
如果您的查询有任何问题,请检查面板左上角的红色感叹号
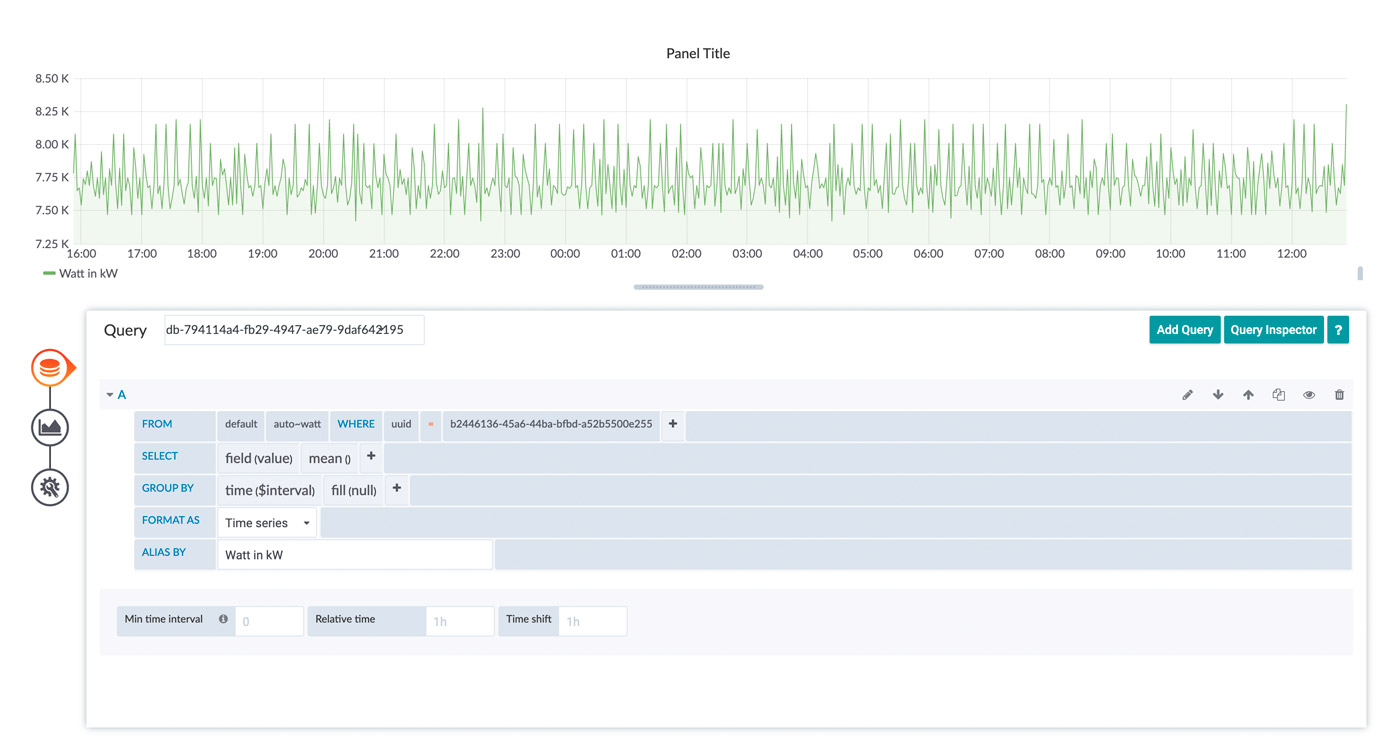
这是最简单的可视化方法,您的选择取决于您想看到什么。 了解方法如何运行的最佳方式就是尝试。
选择可视化
点击您目前使用的面板左侧的图表
利用此工具,您能够对图形进行个性化设置。 点击“可视化”旁边的“图表”框
现在,您可以选择要用于测量的可视化效果。有几个可视化选项可以从中选择。 应注意的是,并非每种可视化都适用于每种类型的数据。
您看到的取决于您选择的。 了解方法如何运行的最佳方式就是尝试。

您还可以使用插件添加新的可视化选项,或者删除您不需要的旧选项。
选择可视化选项后,您可以按需求对其进行编辑。 每个可视化选项都有不同的设置,从更改名称到以不同方式可视化您的数据。
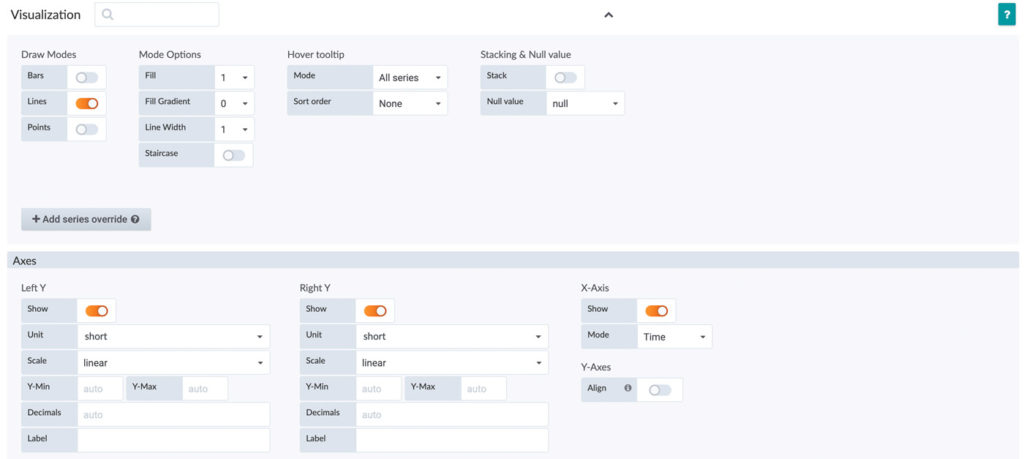
例如,这里您可以看到图形可视化的选项。
现在您可以按照您需要的格式编辑可视化。 您可以将“绘图模式”从线形更改为条形,用数据填充间隙,更改轴的单位或比例。
通过尝试不同类型的选项,您可以更深入地了解如何制作仪表板并对其进行个性化设置
一般选项
在“标题”旁边的框中,您可以选择面板名称。
通过“透明”选项,您可以在透明和非透明面板之间进行选择。
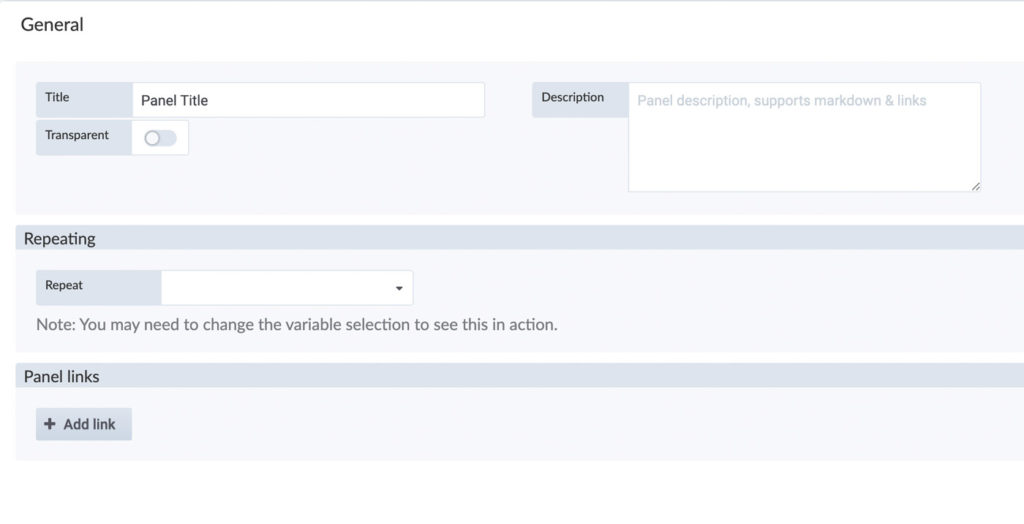
如需要,您可以添加描述,用以支持标记和链接。
喜欢来自PROFICLOUD-Organization的模板化仪表板并想自行修改它们?
您可以在这里下载文件并将其导入您个人的组织!请注意,导入个人版本后,修改后的仪表板将不会收到模板更新。
所有设备的设备模板仪表板:
{
"__inputs": [
{
"name": "DS_PROFICLOUD",
"label": "Proficloud",
"description": "",
"type": "datasource",
"pluginId": "influxdb",
"pluginName": "InfluxDB"
}
],
"__requires": [
{
"type": "grafana",
"id": "grafana",
"name": "Grafana",
"version": "7.4.2"
},
{
"type": "panel",
"id": "graph",
"name": "Graph",
"version": ""
},
{
"type": "datasource",
"id": "influxdb",
"name": "InfluxDB",
"version": "1.0.0"
},
{
"type": "panel",
"id": "stat",
"name": "Stat",
"version": ""
},
{
"type": "panel",
"id": "table",
"name": "Table",
"version": ""
}
],
"annotations": {
"list": [
{
"builtIn": 1,
"datasource": "-- Grafana --",
"enable": true,
"hide": true,
"iconColor": "rgba(0, 211, 255, 1)",
"name": "Annotations & Alerts",
"type": "dashboard"
}
]
},
"description": "Default template for device data view",
"editable": true,
"gnetId": null,
"graphTooltip": 0,
"id": null,
"iteration": 1617691854610,
"links": [],
"panels": [
{
"collapsed": false,
"datasource": "${DS_PROFICLOUD}",
"gridPos": {
"h": 1,
"w": 24,
"x": 0,
"y": 0
},
"id": 14,
"panels": [],
"title": "Health",
"type": "row"
},
{
"cacheTimeout": null,
"datasource": "${DS_PROFICLOUD}",
"description": "Device Status\n\nFor more information please check the Proficloud Device Manager",
"fieldConfig": {
"defaults": {
"color": {
"mode": "thresholds"
},
"custom": {},
"mappings": [
{
"id": 0,
"op": "=",
"text": "No data in selected time range",
"type": 1,
"value": "null"
},
{
"id": 1,
"op": "=",
"text": "No Action needed",
"type": 1,
"value": "0"
},
{
"id": 2,
"op": "=",
"text": "Action needed",
"type": 1,
"value": "1"
},
{
"id": 3,
"op": "=",
"text": "Device failure - Action needed",
"type": 1,
"value": "2"
}
],
"thresholds": {
"mode": "absolute",
"steps": [
{
"color": "rgba(255, 255, 255, 0)",
"value": null
},
{
"color": "rgb(255, 204, 0)",
"value": 1
},
{
"color": "rgb(245, 20, 35)",
"value": 2
}
]
},
"unit": "none"
},
"overrides": []
},
"gridPos": {
"h": 2,
"w": 24,
"x": 0,
"y": 1
},
"id": 4,
"interval": null,
"links": [],
"maxDataPoints": 100,
"options": {
"colorMode": "background",
"graphMode": "none",
"justifyMode": "auto",
"orientation": "horizontal",
"reduceOptions": {
"calcs": [
"lastNotNull"
],
"fields": "",
"values": false
},
"text": {},
"textMode": "value"
},
"pluginVersion": "7.4.2",
"targets": [
{
"groupBy": [],
"measurement": "con_trafficlights",
"orderByTime": "ASC",
"policy": "default",
"refId": "A",
"resultFormat": "time_series",
"select": [
[
{
"params": [
"con_TrafficLightColor"
],
"type": "field"
}
]
],
"tags": [
{
"key": "kaaEndpointID",
"operator": "=",
"value": "$uuid"
}
]
}
],
"timeFrom": "10m",
"timeShift": null,
"title": "Device Status",
"type": "stat"
},
{
"datasource": "${DS_PROFICLOUD}",
"description": "",
"fieldConfig": {
"defaults": {
"color": {
"mode": "thresholds"
},
"custom": {
"align": null,
"filterable": false
},
"decimals": 2,
"displayName": "Status Message",
"mappings": [],
"thresholds": {
"mode": "absolute",
"steps": [
{
"color": "green",
"value": null
},
{
"color": "red",
"value": 80
}
]
},
"unit": "short"
},
"overrides": [
{
"matcher": {
"id": "byName",
"options": "Time"
},
"properties": [
{
"id": "displayName",
"value": "Time"
},
{
"id": "custom.align",
"value": null
}
]
}
]
},
"gridPos": {
"h": 3,
"w": 24,
"x": 0,
"y": 3
},
"id": 10,
"options": {
"showHeader": true
},
"pluginVersion": "7.4.2",
"targets": [
{
"groupBy": [],
"measurement": "con_trafficlights",
"orderByTime": "ASC",
"policy": "default",
"refId": "A",
"resultFormat": "table",
"select": [
[
{
"params": [
"con_TrafficLightMessage"
],
"type": "field"
},
{
"params": [],
"type": "last"
}
]
],
"tags": [
{
"key": "kaaEndpointID",
"operator": "=",
"value": "$uuid"
}
]
}
],
"timeFrom": "10m",
"timeShift": null,
"title": "Status Message",
"transformations": [
{
"id": "merge",
"options": {
"reducers": []
}
}
],
"type": "table"
},
{
"datasource": "${DS_PROFICLOUD}",
"fieldConfig": {
"defaults": {
"color": {
"mode": "thresholds"
},
"custom": {
"align": null,
"filterable": false
},
"decimals": 0,
"displayName": "",
"mappings": [],
"thresholds": {
"mode": "absolute",
"steps": [
{
"color": "green",
"value": null
},
{
"color": "red",
"value": 80
}
]
},
"unit": "short"
},
"overrides": [
{
"matcher": {
"id": "byName",
"options": "Time"
},
"properties": [
{
"id": "displayName",
"value": "Time"
},
{
"id": "unit",
"value": "time: YYYY-MM-DD HH:mm:ss"
},
{
"id": "custom.align",
"value": null
}
]
}
]
},
"gridPos": {
"h": 7,
"w": 24,
"x": 0,
"y": 6
},
"id": 6,
"options": {
"showHeader": true
},
"pluginVersion": "7.4.2",
"targets": [
{
"alias": "$col",
"groupBy": [],
"hide": false,
"measurement": "con_logs",
"orderByTime": "ASC",
"policy": "default",
"query": "SELECT \"con_LogLevel\", \"con_LogMessage\", \"con_LogTags\" FROM \"con_logs\" WHERE (\"kaaEndpointID\" = '$uuid') AND $timeFilter",
"rawQuery": false,
"refId": "A",
"resultFormat": "time_series",
"select": [
[
{
"params": [
"con_LogLevel"
],
"type": "field"
},
{
"params": [
"Log Level"
],
"type": "alias"
}
],
[
{
"params": [
"con_LogMessage"
],
"type": "field"
},
{
"params": [
"Log Message"
],
"type": "alias"
}
],
[
{
"params": [
"con_LogTags"
],
"type": "field"
},
{
"params": [
"Log Tags"
],
"type": "alias"
}
]
],
"tags": [
{
"key": "kaaEndpointID",
"operator": "=",
"value": "$uuid"
}
]
}
],
"timeFrom": null,
"timeShift": null,
"title": "Log Messages",
"transformations": [
{
"id": "seriesToColumns",
"options": {
"reducers": []
}
}
],
"type": "table"
},
{
"collapsed": false,
"datasource": "${DS_PROFICLOUD}",
"gridPos": {
"h": 1,
"w": 24,
"x": 0,
"y": 13
},
"id": 12,
"panels": [],
"repeat": null,
"title": "Metrics",
"type": "row"
},
{
"aliasColors": {},
"bars": false,
"dashLength": 10,
"dashes": false,
"datasource": "${DS_PROFICLOUD}",
"description": "",
"fieldConfig": {
"defaults": {
"custom": {},
"links": []
},
"overrides": []
},
"fill": 1,
"fillGradient": 0,
"gridPos": {
"h": 9,
"w": 24,
"x": 0,
"y": 14
},
"hiddenSeries": false,
"id": 8,
"legend": {
"avg": false,
"current": false,
"max": false,
"min": false,
"show": true,
"total": false,
"values": false
},
"lines": true,
"linewidth": 1,
"maxPerRow": 4,
"nullPointMode": "null",
"options": {
"alertThreshold": true
},
"percentage": false,
"pluginVersion": "7.4.2",
"pointradius": 2,
"points": false,
"renderer": "flot",
"repeat": "metrics",
"repeatDirection": "v",
"seriesOverrides": [],
"spaceLength": 10,
"stack": false,
"steppedLine": false,
"targets": [
{
"groupBy": [
{
"params": [
"$__interval"
],
"type": "time"
},
{
"params": [
"none"
],
"type": "fill"
}
],
"measurement": "/^$metrics$/",
"orderByTime": "ASC",
"policy": "default",
"query": "SELECT * WHERE (\"kaaEndpointID\" =~ /^$uuid$/) AND $timeFilter",
"rawQuery": false,
"refId": "A",
"resultFormat": "time_series",
"select": [
[
{
"params": [
"*"
],
"type": "field"
},
{
"params": [],
"type": "mean"
}
]
],
"tags": [
{
"key": "kaaEndpointID",
"operator": "=",
"value": "$uuid"
}
]
}
],
"thresholds": [],
"timeFrom": null,
"timeRegions": [],
"timeShift": null,
"title": "$metrics",
"tooltip": {
"shared": true,
"sort": 0,
"value_type": "individual"
},
"type": "graph",
"xaxis": {
"buckets": null,
"mode": "time",
"name": null,
"show": true,
"values": []
},
"yaxes": [
{
"format": "short",
"label": null,
"logBase": 1,
"max": null,
"min": null,
"show": true
},
{
"format": "short",
"label": null,
"logBase": 1,
"max": null,
"min": null,
"show": true
}
],
"yaxis": {
"align": false,
"alignLevel": null
}
}
],
"refresh": "10s",
"schemaVersion": 27,
"style": "dark",
"tags": [],
"templating": {
"list": [
{
"allValue": null,
"current": {},
"datasource": "${DS_PROFICLOUD}",
"definition": "SHOW UUIDS",
"description": null,
"error": null,
"hide": 0,
"includeAll": false,
"label": "UUID:",
"multi": false,
"name": "uuid",
"options": [],
"query": "SHOW UUIDS",
"refresh": 1,
"regex": "",
"skipUrlSync": false,
"sort": 0,
"tagValuesQuery": "",
"tags": [],
"tagsQuery": "",
"type": "query",
"useTags": false
},
{
"allValue": null,
"current": {},
"datasource": "${DS_PROFICLOUD}",
"definition": "SHOW SERIES WHERE \"kaaEndpointID\" = '$uuid' AND $timeFilter",
"description": null,
"error": null,
"hide": 2,
"includeAll": true,
"label": "Select Metric:",
"multi": true,
"name": "metrics",
"options": [],
"query": "SHOW SERIES WHERE \"kaaEndpointID\" = '$uuid' AND $timeFilter",
"refresh": 2,
"regex": "/^(?!con_|timestamp|auto~con_LogLevel|auto~con_TrafficLightColor|auto~timestamp|auto~con_UpdateId|auto~con_UpdateStatus)([^,]+)/",
"skipUrlSync": false,
"sort": 5,
"tagValuesQuery": "",
"tags": [],
"tagsQuery": "",
"type": "query",
"useTags": false
}
]
},
"time": {
"from": "now-1h",
"to": "now"
},
"timepicker": {
"refresh_intervals": [
"10s",
"30s",
"1m",
"5m",
"15m",
"30m",
"1h",
"2h",
"1d"
]
},
"timezone": "",
"title": "Device Template",
"uid": "device_basic_template",
"version": 12
}EMpro template:
{
"__inputs": [
{
"name": "DS_PROFICLOUD",
"label": "Proficloud",
"description": "",
"type": "datasource",
"pluginId": "influxdb",
"pluginName": "InfluxDB"
}
],
"__requires": [
{
"type": "grafana",
"id": "grafana",
"name": "Grafana",
"version": "7.4.2"
},
{
"type": "panel",
"id": "graph",
"name": "Graph",
"version": ""
},
{
"type": "datasource",
"id": "influxdb",
"name": "InfluxDB",
"version": "1.0.0"
},
{
"type": "panel",
"id": "singlestat",
"name": "Singlestat",
"version": ""
},
{
"type": "panel",
"id": "table",
"name": "Table",
"version": ""
}
],
"annotations": {
"list": [
{
"builtIn": 1,
"datasource": "-- Grafana --",
"enable": true,
"hide": true,
"iconColor": "rgba(0, 211, 255, 1)",
"name": "Annotations & Alerts",
"type": "dashboard"
}
]
},
"editable": true,
"gnetId": null,
"graphTooltip": 0,
"id": null,
"iteration": 1617691881604,
"links": [],
"panels": [
{
"collapsed": false,
"datasource": "${DS_PROFICLOUD}",
"gridPos": {
"h": 1,
"w": 24,
"x": 0,
"y": 0
},
"id": 18,
"panels": [],
"title": "Health",
"type": "row"
},
{
"cacheTimeout": null,
"colorBackground": true,
"colorValue": false,
"colors": [
"rgba(41, 156, 70, 0)",
"rgb(255, 204, 0)",
"rgb(245, 20, 35)"
],
"datasource": "${DS_PROFICLOUD}",
"description": "Device Status\n\nFor more information please check the Proficloud Device Manager",
"fieldConfig": {
"defaults": {
"custom": {}
},
"overrides": []
},
"format": "none",
"gauge": {
"maxValue": 100,
"minValue": 0,
"show": false,
"thresholdLabels": false,
"thresholdMarkers": true
},
"gridPos": {
"h": 2,
"w": 24,
"x": 0,
"y": 1
},
"id": 20,
"interval": null,
"links": [],
"mappingType": 1,
"mappingTypes": [
{
"$$hashKey": "object:119",
"name": "value to text",
"value": 1
},
{
"$$hashKey": "object:120",
"name": "range to text",
"value": 2
}
],
"maxDataPoints": 100,
"nullPointMode": "connected",
"nullText": null,
"postfix": "",
"postfixFontSize": "50%",
"prefix": "",
"prefixFontSize": "50%",
"rangeMaps": [
{
"from": "null",
"text": "N/A",
"to": "null"
}
],
"sparkline": {
"fillColor": "rgba(31, 118, 189, 0.18)",
"full": false,
"lineColor": "rgb(31, 120, 193)",
"show": false,
"ymax": null,
"ymin": null
},
"tableColumn": "",
"targets": [
{
"groupBy": [
{
"params": [
"$__interval"
],
"type": "time"
},
{
"params": [
"none"
],
"type": "fill"
}
],
"orderByTime": "ASC",
"policy": "default",
"query": "SELECT \"con_TrafficLightColor\" FROM \"con_trafficlights\" WHERE (\"uuid\" = '$uuid') AND $timeFilter",
"rawQuery": true,
"refId": "A",
"resultFormat": "time_series",
"select": [
[
{
"params": [
"value"
],
"type": "field"
},
{
"params": [],
"type": "mean"
}
]
],
"tags": []
}
],
"thresholds": "1,2",
"timeFrom": "10m",
"timeShift": null,
"title": "",
"type": "singlestat",
"valueFontSize": "50%",
"valueMaps": [
{
"$$hashKey": "object:122",
"op": "=",
"text": "No data in selected time range",
"value": "null"
},
{
"$$hashKey": "object:123",
"op": "=",
"text": "No Action needed",
"value": "0"
},
{
"$$hashKey": "object:124",
"op": "=",
"text": "Action needed",
"value": "1"
},
{
"$$hashKey": "object:125",
"op": "=",
"text": "Device failure - Action needed",
"value": "2"
}
],
"valueName": "current"
},
{
"datasource": "${DS_PROFICLOUD}",
"fieldConfig": {
"defaults": {
"color": {
"mode": "thresholds"
},
"custom": {
"align": "",
"filterable": false
},
"decimals": 2,
"displayName": "Status Message",
"mappings": [],
"thresholds": {
"mode": "absolute",
"steps": [
{
"color": "green",
"value": null
},
{
"color": "red",
"value": 80
}
]
},
"unit": "short"
},
"overrides": [
{
"matcher": {
"id": "byName",
"options": "Time"
},
"properties": [
{
"id": "displayName",
"value": "Time"
},
{
"id": "custom.align",
"value": null
}
]
}
]
},
"gridPos": {
"h": 3,
"w": 24,
"x": 0,
"y": 3
},
"id": 22,
"options": {
"showHeader": true
},
"pluginVersion": "7.4.2",
"targets": [
{
"groupBy": [
{
"params": [
"$__interval"
],
"type": "time"
},
{
"params": [
"none"
],
"type": "fill"
}
],
"orderByTime": "ASC",
"policy": "default",
"query": "SELECT last(\"con_TrafficLightMessage\") FROM \"con_trafficlights\" WHERE (\"uuid\" = '$uuid') AND $timeFilter",
"rawQuery": true,
"refId": "A",
"resultFormat": "table",
"select": [
[
{
"params": [
"value"
],
"type": "field"
},
{
"params": [],
"type": "mean"
}
]
],
"tags": []
}
],
"timeFrom": "10m",
"timeShift": null,
"title": "",
"transformations": [
{
"id": "merge",
"options": {
"reducers": []
}
}
],
"type": "table"
},
{
"datasource": "${DS_PROFICLOUD}",
"fieldConfig": {
"defaults": {
"color": {
"mode": "thresholds"
},
"custom": {
"align": "",
"filterable": false
},
"decimals": 0,
"displayName": "",
"mappings": [],
"thresholds": {
"mode": "absolute",
"steps": [
{
"color": "green",
"value": null
},
{
"color": "red",
"value": 80
}
]
},
"unit": "short"
},
"overrides": [
{
"matcher": {
"id": "byName",
"options": "Time"
},
"properties": [
{
"id": "displayName",
"value": "Time"
},
{
"id": "unit",
"value": "time: YYYY-MM-DD HH:mm:ss"
},
{
"id": "custom.align",
"value": null
}
]
}
]
},
"gridPos": {
"h": 5,
"w": 24,
"x": 0,
"y": 6
},
"id": 24,
"options": {
"showHeader": true
},
"pluginVersion": "7.4.2",
"targets": [
{
"alias": "$col",
"groupBy": [],
"orderByTime": "ASC",
"policy": "default",
"query": "SELECT \"con_LogLevel\" AS \"Log Level\", \"con_LogMessage\" AS \"Log Message\", \"con_LogTags\" AS \"Log Tags\" FROM \"con_logs\" WHERE (\"uuid\" = '$uuid') AND $timeFilter",
"rawQuery": true,
"refId": "A",
"resultFormat": "time_series",
"select": [
[
{
"params": [
"value"
],
"type": "field"
},
{
"params": [],
"type": "mean"
}
]
],
"tags": []
}
],
"timeFrom": null,
"timeShift": null,
"title": "Log Messages",
"transformations": [
{
"id": "seriesToColumns",
"options": {
"reducers": []
}
}
],
"type": "table"
},
{
"collapsed": false,
"datasource": "${DS_PROFICLOUD}",
"gridPos": {
"h": 1,
"w": 24,
"x": 0,
"y": 11
},
"id": 16,
"panels": [],
"title": "EMPRO",
"type": "row"
},
{
"aliasColors": {},
"bars": true,
"dashLength": 10,
"dashes": false,
"datasource": "${DS_PROFICLOUD}",
"fieldConfig": {
"defaults": {
"custom": {},
"links": []
},
"overrides": []
},
"fill": 1,
"fillGradient": 0,
"gridPos": {
"h": 8,
"w": 24,
"x": 0,
"y": 12
},
"hiddenSeries": false,
"id": 4,
"legend": {
"alignAsTable": true,
"avg": true,
"current": false,
"max": true,
"min": true,
"show": true,
"total": true,
"values": true
},
"lines": false,
"linewidth": 1,
"nullPointMode": "null",
"options": {
"alertThreshold": true
},
"percentage": false,
"pluginVersion": "7.4.2",
"pointradius": 2,
"points": false,
"renderer": "flot",
"seriesOverrides": [],
"spaceLength": 10,
"stack": false,
"steppedLine": false,
"targets": [
{
"alias": "E",
"groupBy": [
{
"params": [
"$timerange"
],
"type": "time"
},
{
"params": [
"none"
],
"type": "fill"
}
],
"measurement": "auto~P",
"orderByTime": "ASC",
"policy": "default",
"query": "SELECT integral(\"value\") FROM \"P\" WHERE (\"kaaEndpointID\" = '6c11bdb0-9212-42a7-8f9b-53ac9bb245ab') AND $timeFilter GROUP BY time($__interval) fill(null)",
"rawQuery": false,
"refId": "A",
"resultFormat": "time_series",
"select": [
[
{
"params": [
"value"
],
"type": "field"
},
{
"params": [],
"type": "integral"
},
{
"params": [
" / 3600"
],
"type": "math"
}
]
],
"tags": [
{
"key": "uuid",
"operator": "=",
"value": "$uuid"
}
]
}
],
"thresholds": [],
"timeFrom": null,
"timeRegions": [],
"timeShift": null,
"title": "Total Active Energy",
"tooltip": {
"shared": true,
"sort": 0,
"value_type": "individual"
},
"type": "graph",
"xaxis": {
"buckets": null,
"mode": "time",
"name": null,
"show": true,
"values": []
},
"yaxes": [
{
"format": "watth",
"label": null,
"logBase": 1,
"max": null,
"min": null,
"show": true
},
{
"format": "short",
"label": null,
"logBase": 1,
"max": null,
"min": null,
"show": true
}
],
"yaxis": {
"align": false,
"alignLevel": null
}
},
{
"aliasColors": {},
"bars": false,
"dashLength": 10,
"dashes": false,
"datasource": "${DS_PROFICLOUD}",
"fieldConfig": {
"defaults": {
"custom": {},
"links": []
},
"overrides": []
},
"fill": 0,
"fillGradient": 0,
"gridPos": {
"h": 8,
"w": 24,
"x": 0,
"y": 20
},
"hiddenSeries": false,
"id": 2,
"legend": {
"alignAsTable": true,
"avg": true,
"current": true,
"max": true,
"min": true,
"rightSide": false,
"show": true,
"total": false,
"values": true
},
"lines": true,
"linewidth": 1,
"nullPointMode": "null",
"options": {
"alertThreshold": true
},
"percentage": false,
"pluginVersion": "7.4.2",
"pointradius": 2,
"points": false,
"renderer": "flot",
"seriesOverrides": [],
"spaceLength": 10,
"stack": false,
"steppedLine": false,
"targets": [
{
"alias": "P",
"groupBy": [
{
"params": [
"$__interval"
],
"type": "time"
},
{
"params": [
"none"
],
"type": "fill"
}
],
"measurement": "auto~P",
"orderByTime": "ASC",
"policy": "default",
"refId": "A",
"resultFormat": "time_series",
"select": [
[
{
"params": [
"value"
],
"type": "field"
},
{
"params": [],
"type": "mean"
}
]
],
"tags": [
{
"key": "uuid",
"operator": "=",
"value": "$uuid"
}
]
}
],
"thresholds": [
{
"colorMode": "warning",
"fill": false,
"line": true,
"op": "gt",
"value": 230,
"yaxis": "left"
},
{
"colorMode": "critical",
"fill": false,
"fillColor": "rgba(50, 116, 217, 0.2)",
"line": true,
"lineColor": "rgba(31, 96, 196, 0.6)",
"op": "gt",
"value": 300,
"yaxis": "left"
}
],
"timeFrom": null,
"timeRegions": [],
"timeShift": null,
"title": "Total Active Power",
"tooltip": {
"shared": true,
"sort": 0,
"value_type": "individual"
},
"type": "graph",
"xaxis": {
"buckets": null,
"mode": "time",
"name": null,
"show": true,
"values": []
},
"yaxes": [
{
"format": "watt",
"label": "",
"logBase": 1,
"max": null,
"min": null,
"show": true
},
{
"format": "short",
"label": null,
"logBase": 1,
"max": null,
"min": null,
"show": true
}
],
"yaxis": {
"align": false,
"alignLevel": null
}
},
{
"aliasColors": {},
"bars": false,
"dashLength": 10,
"dashes": false,
"datasource": "${DS_PROFICLOUD}",
"fieldConfig": {
"defaults": {
"custom": {},
"links": []
},
"overrides": []
},
"fill": 0,
"fillGradient": 0,
"gridPos": {
"h": 8,
"w": 24,
"x": 0,
"y": 28
},
"hiddenSeries": false,
"id": 10,
"legend": {
"alignAsTable": true,
"avg": true,
"current": true,
"max": true,
"min": true,
"show": true,
"total": false,
"values": true
},
"lines": true,
"linewidth": 1,
"nullPointMode": "null",
"options": {
"alertThreshold": true
},
"percentage": false,
"pluginVersion": "7.4.2",
"pointradius": 2,
"points": false,
"renderer": "flot",
"seriesOverrides": [],
"spaceLength": 10,
"stack": false,
"steppedLine": false,
"targets": [
{
"alias": "P",
"groupBy": [
{
"params": [
"$__interval"
],
"type": "time"
},
{
"params": [
"none"
],
"type": "fill"
}
],
"measurement": "auto~P",
"orderByTime": "ASC",
"policy": "default",
"refId": "A",
"resultFormat": "time_series",
"select": [
[
{
"params": [
"value"
],
"type": "field"
},
{
"params": [],
"type": "mean"
}
]
],
"tags": [
{
"key": "uuid",
"operator": "=",
"value": "$uuid"
}
]
},
{
"alias": "Q",
"groupBy": [
{
"params": [
"$__interval"
],
"type": "time"
},
{
"params": [
"none"
],
"type": "fill"
}
],
"measurement": "auto~Q",
"orderByTime": "ASC",
"policy": "default",
"refId": "B",
"resultFormat": "time_series",
"select": [
[
{
"params": [
"value"
],
"type": "field"
},
{
"params": [],
"type": "mean"
}
]
],
"tags": [
{
"key": "uuid",
"operator": "=",
"value": "$uuid"
}
]
},
{
"alias": "S",
"groupBy": [
{
"params": [
"$__interval"
],
"type": "time"
},
{
"params": [
"none"
],
"type": "fill"
}
],
"measurement": "auto~S",
"orderByTime": "ASC",
"policy": "default",
"refId": "C",
"resultFormat": "time_series",
"select": [
[
{
"params": [
"value"
],
"type": "field"
},
{
"params": [],
"type": "mean"
}
]
],
"tags": [
{
"key": "uuid",
"operator": "=",
"value": "$uuid"
}
]
}
],
"thresholds": [],
"timeFrom": null,
"timeRegions": [],
"timeShift": null,
"title": "Total Active, Reactive and Apparent Power",
"tooltip": {
"shared": true,
"sort": 0,
"value_type": "individual"
},
"type": "graph",
"xaxis": {
"buckets": null,
"mode": "time",
"name": null,
"show": true,
"values": []
},
"yaxes": [
{
"format": "voltamp",
"label": null,
"logBase": 1,
"max": null,
"min": null,
"show": true
},
{
"format": "watt",
"label": null,
"logBase": 1,
"max": null,
"min": null,
"show": true
}
],
"yaxis": {
"align": false,
"alignLevel": null
}
},
{
"aliasColors": {},
"bars": false,
"dashLength": 10,
"dashes": false,
"datasource": "${DS_PROFICLOUD}",
"fieldConfig": {
"defaults": {
"custom": {},
"links": []
},
"overrides": []
},
"fill": 0,
"fillGradient": 0,
"gridPos": {
"h": 8,
"w": 24,
"x": 0,
"y": 36
},
"hiddenSeries": false,
"id": 12,
"legend": {
"avg": false,
"current": false,
"max": false,
"min": false,
"show": true,
"total": false,
"values": false
},
"lines": true,
"linewidth": 1,
"nullPointMode": "null",
"options": {
"alertThreshold": true
},
"percentage": false,
"pluginVersion": "7.4.2",
"pointradius": 2,
"points": false,
"renderer": "flot",
"seriesOverrides": [
{
"alias": "PF",
"yaxis": 2
}
],
"spaceLength": 10,
"stack": false,
"steppedLine": false,
"targets": [
{
"alias": "P",
"groupBy": [
{
"params": [
"$__interval"
],
"type": "time"
},
{
"params": [
"none"
],
"type": "fill"
}
],
"measurement": "auto~P",
"orderByTime": "ASC",
"policy": "default",
"refId": "A",
"resultFormat": "time_series",
"select": [
[
{
"params": [
"value"
],
"type": "field"
},
{
"params": [],
"type": "mean"
}
]
],
"tags": [
{
"key": "uuid",
"operator": "=",
"value": "$uuid"
}
]
},
{
"alias": "S",
"groupBy": [
{
"params": [
"$__interval"
],
"type": "time"
},
{
"params": [
"none"
],
"type": "fill"
}
],
"measurement": "auto~S",
"orderByTime": "ASC",
"policy": "default",
"refId": "B",
"resultFormat": "time_series",
"select": [
[
{
"params": [
"value"
],
"type": "field"
},
{
"params": [],
"type": "mean"
}
]
],
"tags": [
{
"key": "uuid",
"operator": "=",
"value": "$uuid"
}
]
},
{
"alias": "PF",
"groupBy": [
{
"params": [
"$__interval"
],
"type": "time"
},
{
"params": [
"none"
],
"type": "fill"
}
],
"measurement": "auto~PF",
"orderByTime": "ASC",
"policy": "default",
"refId": "C",
"resultFormat": "time_series",
"select": [
[
{
"params": [
"value"
],
"type": "field"
},
{
"params": [],
"type": "mean"
}
]
],
"tags": [
{
"key": "uuid",
"operator": "=",
"value": "$uuid"
}
]
}
],
"thresholds": [],
"timeFrom": null,
"timeRegions": [],
"timeShift": null,
"title": "Total Active and Apparent Power with Power Factor",
"tooltip": {
"shared": true,
"sort": 0,
"value_type": "individual"
},
"type": "graph",
"xaxis": {
"buckets": null,
"mode": "time",
"name": null,
"show": true,
"values": []
},
"yaxes": [
{
"format": "voltamp",
"label": "P, S",
"logBase": 1,
"max": null,
"min": null,
"show": true
},
{
"decimals": null,
"format": "none",
"label": "Power Factor",
"logBase": 1,
"max": null,
"min": null,
"show": true
}
],
"yaxis": {
"align": false,
"alignLevel": null
}
},
{
"aliasColors": {},
"bars": false,
"dashLength": 10,
"dashes": false,
"datasource": "${DS_PROFICLOUD}",
"fieldConfig": {
"defaults": {
"custom": {},
"links": []
},
"overrides": []
},
"fill": 0,
"fillGradient": 0,
"gridPos": {
"h": 8,
"w": 24,
"x": 0,
"y": 44
},
"hiddenSeries": false,
"id": 6,
"legend": {
"alignAsTable": true,
"avg": true,
"current": true,
"max": true,
"min": true,
"show": true,
"total": false,
"values": true
},
"lines": true,
"linewidth": 1,
"nullPointMode": "null",
"options": {
"alertThreshold": true
},
"percentage": false,
"pluginVersion": "7.4.2",
"pointradius": 2,
"points": false,
"renderer": "flot",
"seriesOverrides": [],
"spaceLength": 10,
"stack": false,
"steppedLine": false,
"targets": [
{
"alias": "U12",
"groupBy": [
{
"params": [
"$__interval"
],
"type": "time"
},
{
"params": [
"none"
],
"type": "fill"
}
],
"measurement": "auto~U12",
"orderByTime": "ASC",
"policy": "default",
"refId": "A",
"resultFormat": "time_series",
"select": [
[
{
"params": [
"value"
],
"type": "field"
},
{
"params": [],
"type": "mean"
}
]
],
"tags": [
{
"key": "uuid",
"operator": "=",
"value": "$uuid"
}
]
},
{
"alias": "U23",
"groupBy": [
{
"params": [
"$__interval"
],
"type": "time"
},
{
"params": [
"none"
],
"type": "fill"
}
],
"measurement": "auto~U23",
"orderByTime": "ASC",
"policy": "default",
"refId": "B",
"resultFormat": "time_series",
"select": [
[
{
"params": [
"value"
],
"type": "field"
},
{
"params": [],
"type": "mean"
}
]
],
"tags": [
{
"key": "uuid",
"operator": "=",
"value": "$uuid"
}
]
},
{
"alias": "U31",
"groupBy": [
{
"params": [
"$__interval"
],
"type": "time"
},
{
"params": [
"none"
],
"type": "fill"
}
],
"measurement": "auto~U31",
"orderByTime": "ASC",
"policy": "default",
"refId": "C",
"resultFormat": "time_series",
"select": [
[
{
"params": [
"value"
],
"type": "field"
},
{
"params": [],
"type": "mean"
}
]
],
"tags": [
{
"key": "uuid",
"operator": "=",
"value": "$uuid"
}
]
}
],
"thresholds": [
{
"colorMode": "custom",
"fill": false,
"fillColor": "rgba(50, 116, 217, 0.2)",
"line": true,
"lineColor": "#A352CC",
"op": "gt",
"value": 400,
"yaxis": "left"
}
],
"timeFrom": null,
"timeRegions": [],
"timeShift": null,
"title": "Line-to-Line Voltages",
"tooltip": {
"shared": true,
"sort": 0,
"value_type": "individual"
},
"type": "graph",
"xaxis": {
"buckets": null,
"mode": "time",
"name": null,
"show": true,
"values": []
},
"yaxes": [
{
"format": "volt",
"label": null,
"logBase": 1,
"max": null,
"min": null,
"show": true
},
{
"format": "short",
"label": null,
"logBase": 1,
"max": null,
"min": null,
"show": true
}
],
"yaxis": {
"align": false,
"alignLevel": null
}
},
{
"aliasColors": {},
"bars": false,
"dashLength": 10,
"dashes": false,
"datasource": "${DS_PROFICLOUD}",
"fieldConfig": {
"defaults": {
"custom": {},
"links": []
},
"overrides": []
},
"fill": 0,
"fillGradient": 0,
"gridPos": {
"h": 8,
"w": 24,
"x": 0,
"y": 52
},
"hiddenSeries": false,
"id": 8,
"legend": {
"alignAsTable": true,
"avg": true,
"current": true,
"max": true,
"min": true,
"show": true,
"total": false,
"values": true
},
"lines": true,
"linewidth": 1,
"nullPointMode": "null",
"options": {
"alertThreshold": true
},
"percentage": false,
"pluginVersion": "7.4.2",
"pointradius": 2,
"points": false,
"renderer": "flot",
"seriesOverrides": [],
"spaceLength": 10,
"stack": false,
"steppedLine": false,
"targets": [
{
"alias": "U1",
"groupBy": [
{
"params": [
"$__interval"
],
"type": "time"
},
{
"params": [
"none"
],
"type": "fill"
}
],
"measurement": "auto~U1",
"orderByTime": "ASC",
"policy": "default",
"refId": "A",
"resultFormat": "time_series",
"select": [
[
{
"params": [
"value"
],
"type": "field"
},
{
"params": [],
"type": "mean"
}
]
],
"tags": [
{
"key": "uuid",
"operator": "=",
"value": "$uuid"
}
]
},
{
"alias": "U2",
"groupBy": [
{
"params": [
"$__interval"
],
"type": "time"
},
{
"params": [
"none"
],
"type": "fill"
}
],
"measurement": "auto~U2",
"orderByTime": "ASC",
"policy": "default",
"refId": "B",
"resultFormat": "time_series",
"select": [
[
{
"params": [
"value"
],
"type": "field"
},
{
"params": [],
"type": "mean"
}
]
],
"tags": [
{
"key": "uuid",
"operator": "=",
"value": "$uuid"
}
]
},
{
"alias": "U3",
"groupBy": [
{
"params": [
"$__interval"
],
"type": "time"
},
{
"params": [
"none"
],
"type": "fill"
}
],
"measurement": "auto~U3",
"orderByTime": "ASC",
"policy": "default",
"refId": "C",
"resultFormat": "time_series",
"select": [
[
{
"params": [
"value"
],
"type": "field"
},
{
"params": [],
"type": "mean"
}
]
],
"tags": [
{
"key": "uuid",
"operator": "=",
"value": "$uuid"
}
]
}
],
"thresholds": [
{
"colorMode": "custom",
"fill": false,
"fillColor": "rgba(50, 116, 217, 0.2)",
"line": true,
"lineColor": "#A352CC",
"op": "gt",
"value": 230,
"yaxis": "left"
}
],
"timeFrom": null,
"timeRegions": [],
"timeShift": null,
"title": "Phase Voltages",
"tooltip": {
"shared": true,
"sort": 0,
"value_type": "individual"
},
"type": "graph",
"xaxis": {
"buckets": null,
"mode": "time",
"name": null,
"show": true,
"values": []
},
"yaxes": [
{
"format": "volt",
"label": null,
"logBase": 1,
"max": null,
"min": null,
"show": true
},
{
"format": "short",
"label": null,
"logBase": 1,
"max": null,
"min": null,
"show": true
}
],
"yaxis": {
"align": false,
"alignLevel": null
}
},
{
"aliasColors": {},
"bars": false,
"dashLength": 10,
"dashes": false,
"datasource": "${DS_PROFICLOUD}",
"fieldConfig": {
"defaults": {
"custom": {},
"links": []
},
"overrides": []
},
"fill": 0,
"fillGradient": 0,
"gridPos": {
"h": 8,
"w": 24,
"x": 0,
"y": 60
},
"hiddenSeries": false,
"id": 14,
"legend": {
"alignAsTable": true,
"avg": true,
"current": true,
"max": true,
"min": true,
"show": true,
"total": false,
"values": true
},
"lines": true,
"linewidth": 1,
"nullPointMode": "null",
"options": {
"alertThreshold": true
},
"percentage": false,
"pluginVersion": "7.4.2",
"pointradius": 2,
"points": false,
"renderer": "flot",
"seriesOverrides": [],
"spaceLength": 10,
"stack": false,
"steppedLine": false,
"targets": [
{
"alias": "I1",
"groupBy": [
{
"params": [
"$__interval"
],
"type": "time"
},
{
"params": [
"none"
],
"type": "fill"
}
],
"measurement": "auto~I1",
"orderByTime": "ASC",
"policy": "default",
"refId": "A",
"resultFormat": "time_series",
"select": [
[
{
"params": [
"value"
],
"type": "field"
},
{
"params": [],
"type": "mean"
}
]
],
"tags": [
{
"key": "uuid",
"operator": "=",
"value": "$uuid"
}
]
},
{
"alias": "I2",
"groupBy": [
{
"params": [
"$__interval"
],
"type": "time"
},
{
"params": [
"none"
],
"type": "fill"
}
],
"measurement": "auto~I2",
"orderByTime": "ASC",
"policy": "default",
"refId": "B",
"resultFormat": "time_series",
"select": [
[
{
"params": [
"value"
],
"type": "field"
},
{
"params": [],
"type": "mean"
}
]
],
"tags": [
{
"key": "uuid",
"operator": "=",
"value": "$uuid"
}
]
},
{
"alias": "I3",
"groupBy": [
{
"params": [
"$__interval"
],
"type": "time"
},
{
"params": [
"none"
],
"type": "fill"
}
],
"measurement": "auto~I3",
"orderByTime": "ASC",
"policy": "default",
"refId": "C",
"resultFormat": "time_series",
"select": [
[
{
"params": [
"value"
],
"type": "field"
},
{
"params": [],
"type": "mean"
}
]
],
"tags": [
{
"key": "uuid",
"operator": "=",
"value": "$uuid"
}
]
}
],
"thresholds": [],
"timeFrom": null,
"timeRegions": [],
"timeShift": null,
"title": "Currents",
"tooltip": {
"shared": true,
"sort": 0,
"value_type": "individual"
},
"type": "graph",
"xaxis": {
"buckets": null,
"mode": "time",
"name": null,
"show": true,
"values": []
},
"yaxes": [
{
"format": "amp",
"label": null,
"logBase": 1,
"max": null,
"min": null,
"show": true
},
{
"format": "short",
"label": null,
"logBase": 1,
"max": null,
"min": null,
"show": true
}
],
"yaxis": {
"align": false,
"alignLevel": null
}
}
],
"refresh": "10s",
"schemaVersion": 27,
"style": "dark",
"tags": [],
"templating": {
"list": [
{
"allValue": null,
"current": {},
"datasource": "${DS_PROFICLOUD}",
"definition": "SHOW UUIDS",
"description": null,
"error": null,
"hide": 0,
"includeAll": false,
"label": "UUID:",
"multi": false,
"name": "uuid",
"options": [],
"query": "SHOW UUIDS",
"refresh": 1,
"regex": "",
"skipUrlSync": false,
"sort": 0,
"tagValuesQuery": "",
"tags": [],
"tagsQuery": "",
"type": "query",
"useTags": false
},
{
"allValue": null,
"current": {
"tags": [],
"text": "1h",
"value": "1h"
},
"description": null,
"error": null,
"hide": 0,
"includeAll": false,
"label": "Time range",
"multi": false,
"name": "timerange",
"options": [
{
"selected": true,
"text": "1h",
"value": "1h"
},
{
"selected": false,
"text": "1w",
"value": "1w,4d"
}
],
"query": "1h, 1w",
"skipUrlSync": false,
"type": "custom"
}
]
},
"time": {
"from": "now-6h",
"to": "now"
},
"timepicker": {
"refresh_intervals": [
"10s",
"30s",
"1m",
"5m",
"15m",
"30m",
"1h",
"2h",
"1d"
]
},
"timezone": "",
"title": "EMpro Template",
"uid": "empro_template",
"version": 11
}
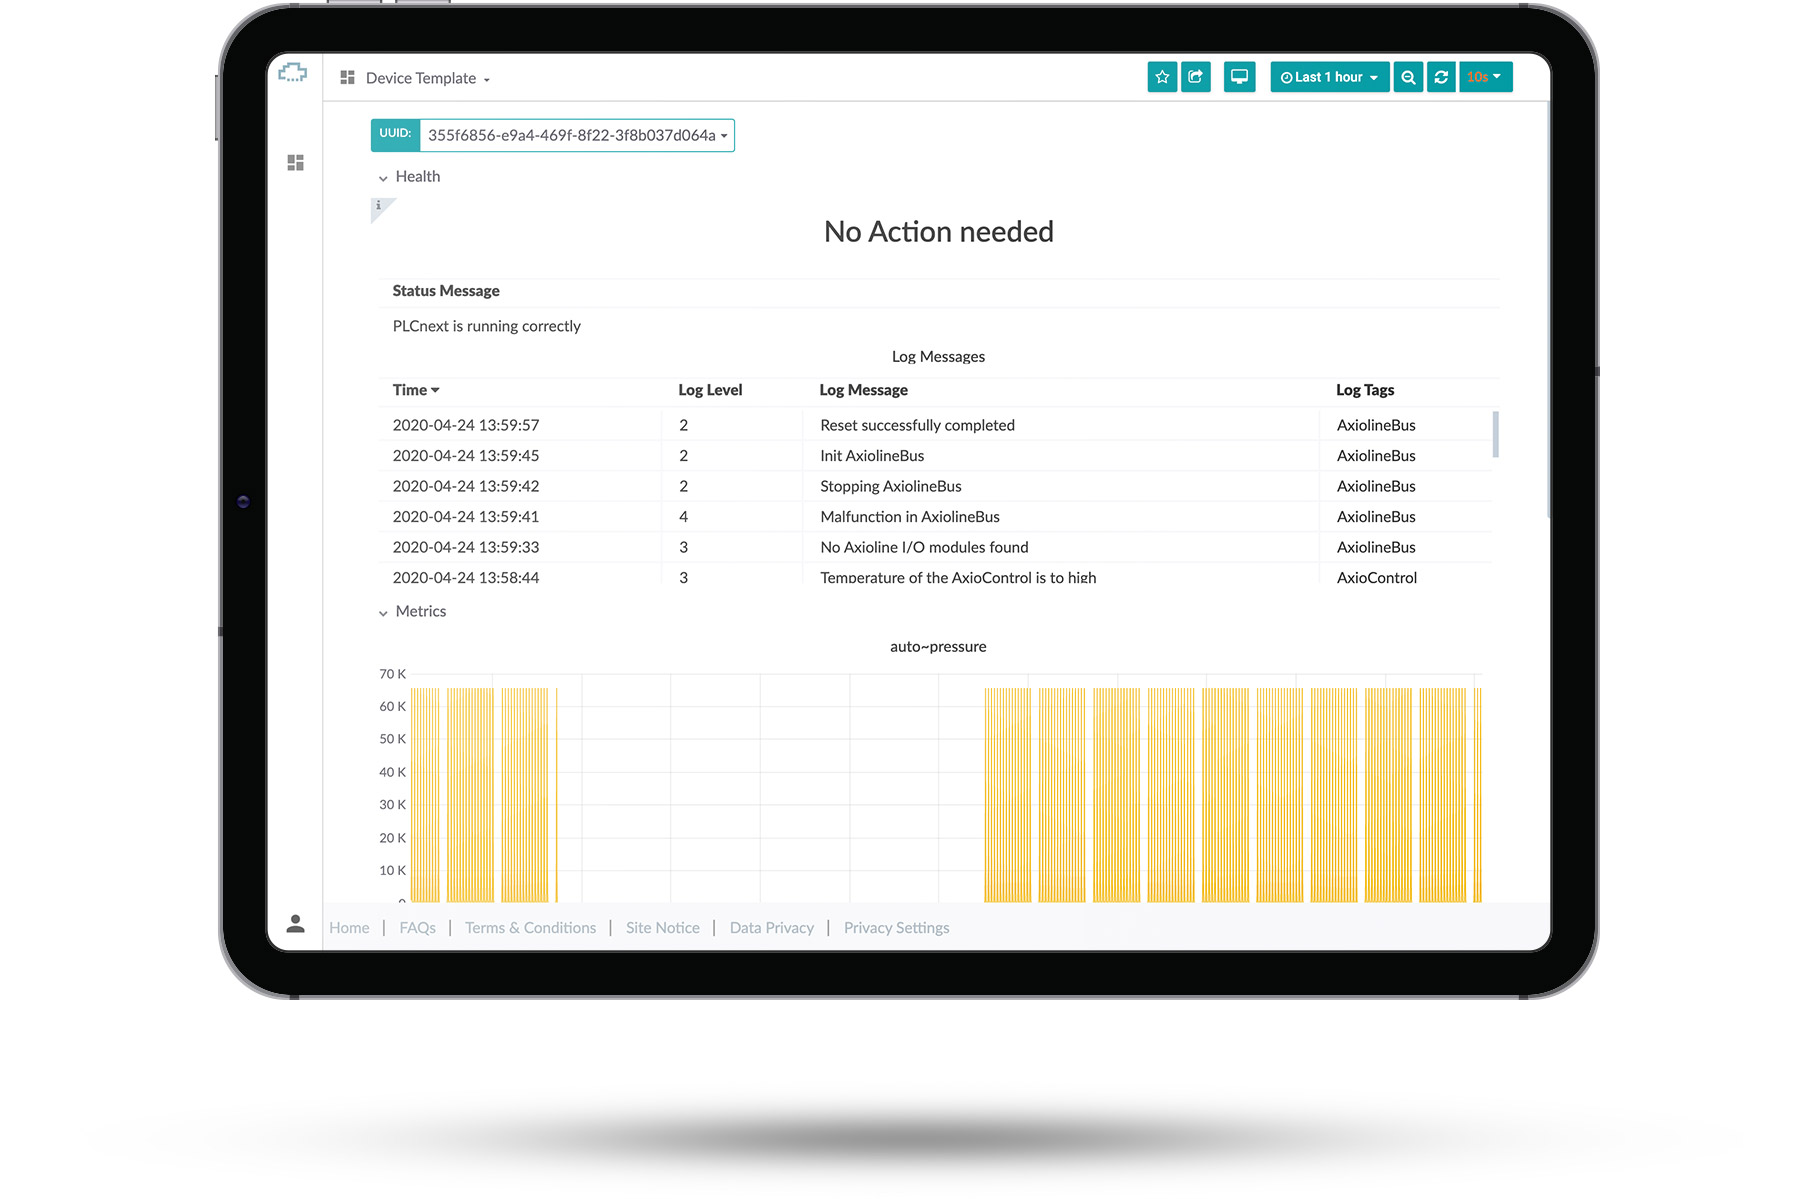
请通过查看侧边栏上的用户配置文件来检查您所在的组织:默认TSD组织“PROFICLOUD”(这是我们用来为您的设备提供的一些默认模板)具有只读访问权限。
如要查看,请点击左侧灰色仪表板按钮并选择“管理”。
您可以看到当前提供的不同默认模板的概述。
选择其中一个查看外观。 选好仪表板后,可以在左上角更改正在查看的设备的UUID。
您可以在那里看到设备的基本信息,并检查它们是否正在运行。 这些预制模板不可编辑或移除。
如要导出仪表板特定面板中的数据,仅需点击面板标题并选择“导出CSV”选项。

您将看到多个CSV导出选项,例如时间戳的模式和格式。选择设置后,点击“导出”,即可生成CSV文件。

我们的云系统将数据传送到您的浏览器,在那里呈现和显示数据。我们将每个查询的数据点设定为最多20000点。 请注意,由于您的屏幕分辨率可能无法显示所有数据,所以单个查询的查询更多数据点无法提供太多信息。这种限制使浏览器中的处理时间受到控制,进而使用户端的响应更加迅速。
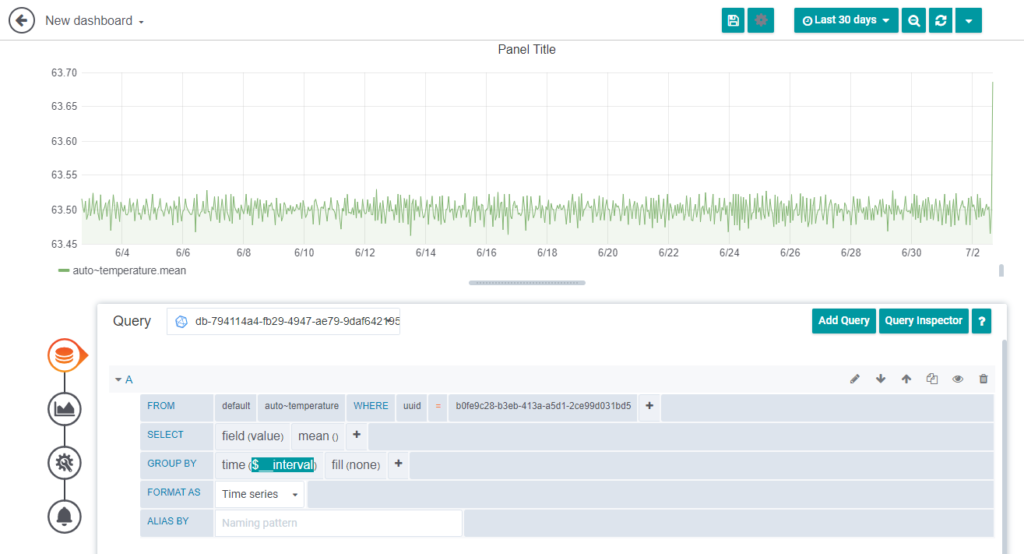
如果需查看更大的时间范围(最终将获得超过20000个数据点),建议您查看查询的分组和聚合参数。我们的模板仪表板默认如此。您可以根据需要选择分组间隔,但通常使用范围为“$__interval”。这将考虑选定的时间范围、您的屏幕分辨率和面板大小,我们的数据库将为您聚合数据。 您可以通过查询编辑器选择不同的聚合选项。 这样做的益处是,负荷转至我们的云系统,从而减少了必须传输到浏览器的数据量。 这也使得浏览器的工作负荷更小,用户体验更佳。以下面的屏幕截图为例:
Time Series Data Service – Alerting
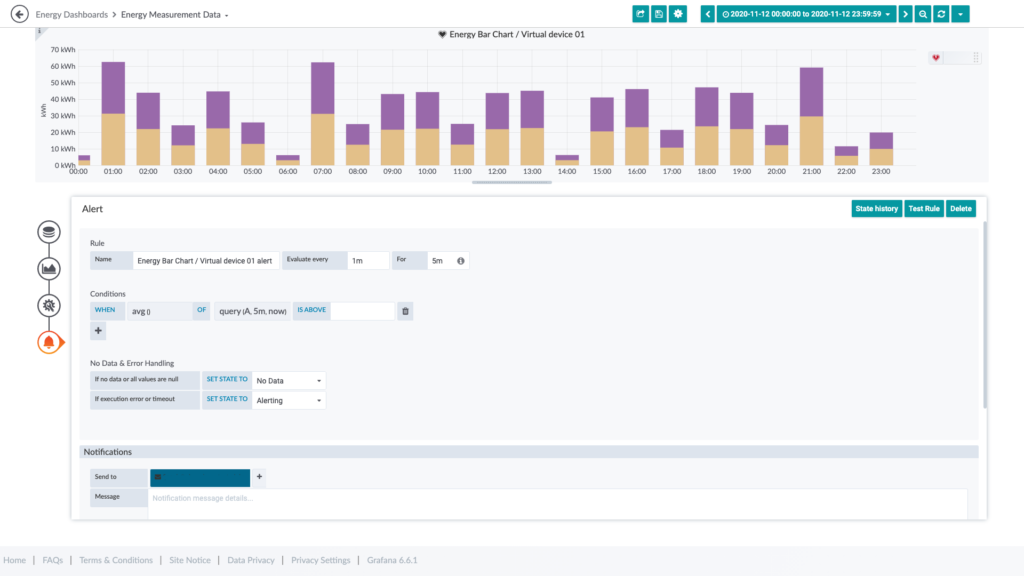
- 导航至您想要添加或编辑警报规则的面板,点击标题,然后点击“编辑”。
- 在“警报”选项卡上,点击“创建警报”。如果该面板已存在警报,则您可以仅编辑“警报”选项卡上的字段。
- 填写字段。
- 名称:输入描述性名称。 该名称将显示在“警报规则”列表中。
- 评估:具体说明调度器评估警报规则的频率。
- 目的: 在触发警报通知之前,具体说明查询需要违反配置的阈值的时间
- 现在选择您的条件,具体说明查询
- 时间:控制如何将每个序列的值降低到可与阈值进行比较的值。点击功能,将其更改为另一功能。
- 关系:具体说明时间范围。 字母定义从“查询”选项卡执行的查询。 “(A,5m,现在)”表示5分钟前到现在。您还可以使用“(A,10m,现在-2m)”来定义10分钟前到2分钟前的时间范围。
- 高于:定义阈值类型和阈值。 您可以点击更改阈值类型。
- 您现在可以在“通知”区域中设置您希望获得通知的方式。
- 点击“发送至”旁边的[+],您可以选择通知方式
- 填写您想在违反阈值时收到的消息。
- 标签:具体说明将包含在通知中的标签列表
- 规则填写完成后,点击右上角的“保存仪表板”,以保存警报规则和仪表板。
- (可选)点击“测试规则”,确保规则返回您期望的结果。
时间序列数据警报允许您接收时间序列数据服务中特定阈值违规的通知。 当您没有登录时间序列数据服务时,也可以通过电子邮件或通讯工具接收这些消息。
您可以创建警报,以便在满足特定规则时获得通知,例如,当您的设备温度高于64摄氏度时,您会收到电子邮件。
- 打开时间序列数据服务,点击左侧导航内的“响铃”,导航至“通知渠道”
- 点击“新建渠道”以设置新的通知渠道。
- 为此,您必须填写一些设置:
- 姓名:输入一个描述性名称,该名称将在您创建新的警报规则和选择通知时显示
- 类型:选择如何发送通知,如电子邮件、Slack、Microsoft Teams……
- 默认:所有警报均使用该通知
- 包括图像: 捕获图像并将其包含在通知中
- 关闭解析消息: 关闭警报状态返回“错误”时发送的解析消息[OK]
- 发送提醒:为触发的警报发送其它通知
作为提醒,您可以将鼠标悬停在“i”符号上以接收更多信息
(可选):测试通知是否发送给您,可以点击底部的“发送测试”。
- 使用适当的警报导航至仪表板内的面板。
- 点击面板名称,然后点击“编辑”。
- 点击设置选项左侧的“响铃”,以获取已配置的警报。
- 点击设置区域右上角的“删除”。
- 点击“删除”以确认删除——面板仍将可用,您仅删除了警报。